Apple AAPL Triggers Bull Flag with Fibonacci Update
If you’ve been on vacation this holiday week, you may have missed the strong Apple (AAPL) bull flag breakout and upward impulse into a known Fibonacci Target.
Let’s quickly update our Apple chart and see these two important chart-based developments:

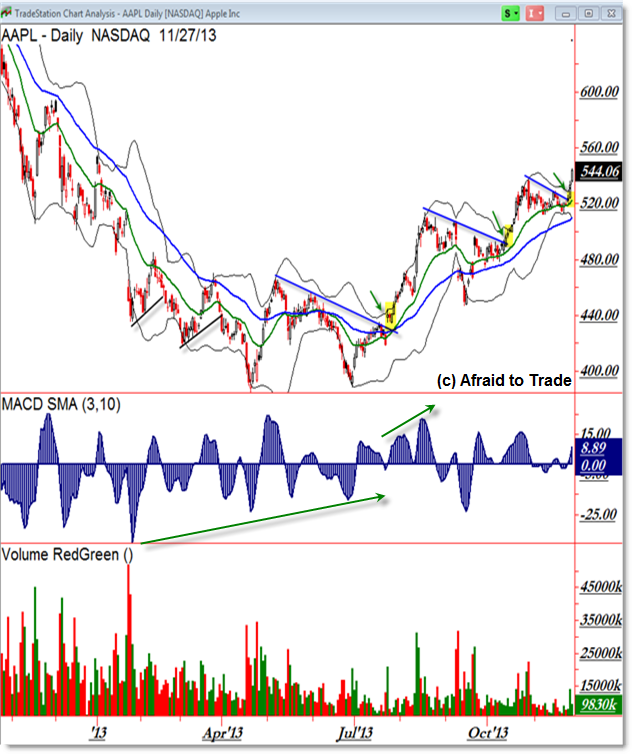
I’ve been highlighting the “Rounded Reversal,” Saucer, Accumulation Pattern (whatever term you prefer to use) to describe the “arc trendline” accumulation pattern into the $400 per share level.
That appears to be the bottom or reversal low from which Apple shares have been trending higher in a “Realization” phase after the August 2013 breakout.
Note the price breakouts from the falling trendlines as highlighted.
The current structure is breaking another key falling short-term ‘flag’ trendline and shares have impulsed higher as a result.
Normally, we would see this breakout as a key movement into “Open Air” where there’s no clear overhead resistance to play for as a target, but if we pull back the perspective, we can see not only a key target that is being achieved, but a new/fresh breakout buy signal in the event you missed the price breakthrough yesterday.
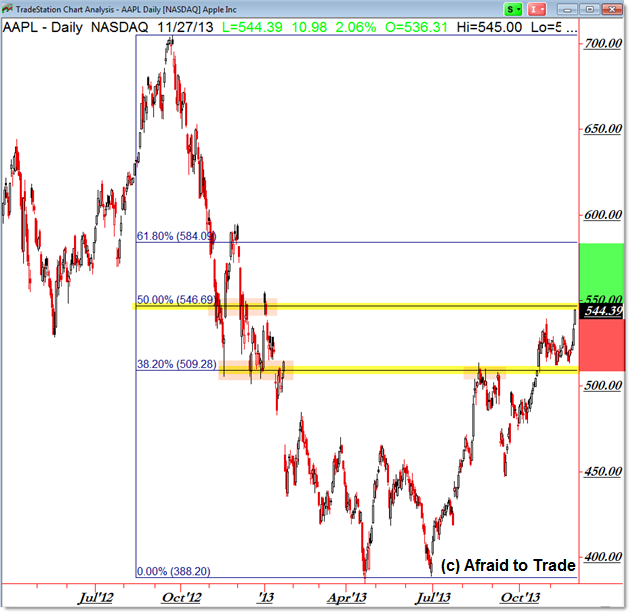
Here’s a pure price and large-scale Fibonacci Grid for Apple (AAPL):

Quickly, we can see the $510 per share as the 38.2% inflection/confluence level from which shares targeted and traded down from in September.
There was an initial bull flag breakout above the $490 per share level in October (similar to now) which carried forward into a second breakout above the $510 level.
That “breakout” trade led to a target play toward the $545 level which has just been achieved with a new bull flag breakout pattern.
Now, we focus our attention on the $547 to $550 level either as a “take profits target” or “breakout buy” candidate on a clean push and trend continuity above $550.
The next upside target – moving through clear “Open Air” – would indeed be the 61.8% Fibonacci Retracement into $585.
Option or stock traders should carefully watch this level and plan trades accordingly.
Here are some additional recent reference posts on Apple (AAPL):
Apple (AAPL) by Price Level Charting into November
Apple (AAPL) Value Areas and Fibonacci Projection Levels (target achieved today)
October Scanning for Most Consecutive Closes (Apple topped the list)
September Bull Flag and Support Planning for Apple (also was successful)
Follow along with members of the Daily Commentary and Idealized Trades summaries for real-time updates and additional trade planning parameters as we watch a “hold and bounce” or “break and retrace” scenario play out in the near future.
Corey Rosenbloom, CMT
Afraid to Trade.com
Follow Corey on Twitter: http://twitter.com/afraidtotrade
Corey’s new book The Complete Trading Course (Wiley Finance) is now available along with the newly released Profiting from the Life Cycle of a Stock Trend presentation (also from Wiley).


We are not simply trading that daily pattern, we are trading a structure that shows a potential shift in dynamics that could have multi-year implications, but we are managing that trade from the perspective of a shorter-term trader on the daily or weekly timeframe.